Even though many states are loosening restrictions and are starting to open back up again, the implications of the COVID-19 pandemic are far from over. This is particularly true in terms of the impact on how you’re able to do business – something that probably won’t be “going back to normal” anytime soon.
Thanks largely to issues like COVID-19 surpluses, experts are already predicting that tax laws are going to tighten in the near future. This is true in light of the fact that the federal government has already sent orders and restrictions to regular taxpayers. Some are suggesting that this may actually cut you off from the resources your plant needs to operate at a time when you really can’t afford to have that happen.
Luckily, you do still have an asset that you can depend on – and a powerful one, at that. Downtime tracking software is about to become more valuable than ever before, for several key reasons that are more than worth exploring.
Tax Laws, COVID-19, and Downtime Tracking: What You Need to Know
To speak to the subject of tax laws, one of the most important that you’ll want to pay attention to moving forward has to do with Section 179. This is a provision in the tax law made possible under the Tax Cuts and Jobs Act that allows business owners like yourself to deduct the full purchase price of qualified equipment from their organization’s gross income.
The good news is that downtime tracking software absolutely falls under that umbrella – meaning that if this isn’t something you’ve already been experimenting with across your enterprise, now would be an excellent time to start thanks to a cost of entry that is far lower than ever before.
But even going beyond that, the purchase of downtime tracking software may very well be your best opportunity to get “back on your feet” once COVID-19 has finally left us behind. At its core, downtime tracking is a viable way to figure out why you’re not working as fast as you should be. You know more than just “I was supposed to produce 500 parts in the last hour and I only produced 400.”
You don’t just know what is happening – you know WHY it’s happening. This provides you with the meaningful, real-time insight you need to actually fix the problem as quickly as possible – thus allowing you to get the most out of the resources you need to operate, regardless of how scarce they may become in the future.
If you’d like to find out more information about what tightening tax laws mean for the resources you need to operate, or if you’re just looking for additional insight into why downtime tracking software can actually help with this issue, please don’t hesitate to contact Thrive today.
Not only will we go over your options about buying out your system, but we’ll also help you write off 100% of that purchase when tax season rolls around yet again!
Awareness of the importance of the OEE metric has been growing among small business owners and managers. Many small manufacturers are looking to implement this metric to maximize their equipment efficiency. However, implementing the OEE metric properly can be a big change. Thankfully, small manufacturers are more agile than larger manufacturers, so they can streamline and restructure their operations more quickly. The main challenge that small manufacturers face is not the time it will take to implement OEE, but the fact they literally cannot afford confusion or poor implementation. Read on to learn how small manufacturers can efficiently implement OEE.
Learn How To Measure OEE Accurately Beforehand
OEE can be calculated using a simple formula. The formula is as follows: OEE= Availability x Performance x Quality. Availability can be calculated using unscheduled time and unplanned downtime. Performance can be calculated using the total number of units produced and the target number of units produced. Quality, of course, is comprised of the number of units that meet quality control standards.
Separate Unscheduled & Unavailable Time
It is important that small manufacturers separate unscheduled and unavailable time. Unscheduled time does not need to be taken into account when reducing downtime. Unavailable time is what comprises OEE downtime. There are several categories of unscheduled time, and only time that falls into these categories should be not be considered. If there is a lack of customer orders, then this time is unscheduled, not unavailable. If there is a lack of resources or personnel caused by forces outside of the company’s control, then this is also unscheduled time. Finally, time spent on research and development work, which may be minimal for a small manufacturer, also counts as unscheduled time.
Calculate OEE Using The Maximum Theoretical Production Speed
Small manufacturers often have not optimized their processes to the same degree that large manufacturers have. This may make it tempting for these small manufacturers to use a target production speed that is lower than the theoretical maximum when calculating OEE. This makes optimal efficiency much easier to achieve. However, OEE calculated with less than the theoretical maximum production speed is not truly optimal efficiency. This may not seem like a big deal, but hitting supposed optimal efficiency (which isn’t really optimal) can breed complacency, which can be a killer for a small manufacturer. A large manufacturing concern can afford stagnation. A small manufacturer needs to focus on sustainable growth, which can come from properly optimizing their business.
Don’t Procrastinate
There will certainly be a learning curve when first measuring OEE and striving to optimize a small There were no Copyscape matches found. manufacturer. Many small businesses, especially small manufacturers, operate on very thin margins. There will inevitably be some inefficiency and confusion when first trying to achieve full OEE. However, a well-thought-out implementation will start paying dividends in short order.
The industrial internet of things, IIoT, is when “smart” sensors are used to boost and upgrade manufacturing and industrial processes. IIoT allows machines to produce real-time analytics and data to help improve communication within your operation. While there are many benefits of IIOT, there are also some challenges within the manufacturing industry.
Integration and Implementation
Integrating information technology and operational technology within IIT is a complicated challenge. Implementing this technology can be even more difficult when all existing machines within an operation are working perfectly fine. When a machine is working, it can be hard to justify a massive expense. You cannot simple pick and choose what IIoT technology you’d like to integrate- it’s essentially all or nothing. This technology would have to complete replace current existing equipment.
Finances
As we briefly stated about, finances are a major challenge with IIoT technology. It’s a massive expense that is simply not practical or possible for many small businesses. IIoT is still considered new technology and the data to back it up can be hard to find. Without seeing the number of operations industrial IoT technology has helped, it can be hard to shell out the cash.
Security
Security is perhaps the biggest concern with IIoT technologies. Security breaches affect not only the operation itself, but the employees within the operation as well. As with any system that stores and analyzes data, IIoT technology is very vulnerable to hacking, along with other security concerns. If, for example, the system or machines are hacked, production could be delayed or halted entirely. Cyber security is also very limited with IIoT which is another main reason that companies are so hesitant to implement it.
Connectivity
Connectivity, or lack thereof, is a challenge that IIoT technology has to overcome. When any system becomes wireless, a myriad of issues follows closely behind. Wireless connection also leaves more room for security issues when not integrated and monitored properly.
Come and Thrive
Is it possible to overcome the challenges that the industrial internet of things technology presents? With the right team and operation, yes.
While industrial IoT brings on many challenges, it has several benefits as well. Real-time analytics and data make IIoT highly effective and efficient within day to day operations. Operators will be able to manage the facility more effectively by keeping machines operating to increase production. Real-time information is also extremely beneficial within logistics and supply chain management. Data can be collected more quickly and predict any issues that could affect inventory.
Have more questions about the challenges you could face with IIoT technology? Give us a call and we will help you thrive: 1 (888) 499-7772.
2019 has proved that the manufacturing industry is continuing to grow and evolve at an explosive rate. As a result of improving technologies, operations are operating more efficiently to save money and boost production. The top 4 manufacturing trends in 2019 are:
1) Industrial Internet of Things
The industrial internet of things, IIoT, is one of the top manufacturing trends in 2019. IIoT is comprised of “smart” sensors that are used to enhance manufacturing and industrial processes and equipment. Industrial IoT allows machines to produce real-time analytics and data to help improve communication and efficiency within your operation.
In its simplest form, industrial IoT is made up of two main components: smart sensors and cloud (wireless) computing.
Many manufacturers believe that IIoT technology will drastically increase profits for manufacturers within the coming years. Industrial IoT technology continues to be fleshed out, but the future is certainly very bright.
2) 3D Printing
While 3D printing is not entirely new technology, it has continued to develop since its creation. 3D printing allows for faster and less expensive production which can save companies time and money. Sounds pretty good, right?
3D printing also allows companies to produce certain items on demand and in-house- no need to bother storage. This technology makes cost-effective, on-site and in-house production possible!
3) Collaborative Robots
Also known as cobots, collaborative robots are made to work side by side with their human counterparts. These incredible pieces of technology continue to aid in production speed, enhance accuracy, and replace unnecessary human labor. Cobots will not completely replace human labor but enhance it. These robots simply work alongside employees to boost production and internal efficiency.
4) Cyber Security
As the industry continues to solidify itself into the digital era, the need for a tight cyber security plan is at an all time high. A cyber security system can help protect your overall operation, the employees within your operation, and confidential customer information. Cyber security breaches can happen to any company, large or small. The most common cyber security breach is hacking, which can not only halt production, but completely shut down a company.
Efficiency realized with Thrive
2019 has been an integral year for technology advances within the manufacturing industry. Success aligns with the four trends that will continue remain prevalent being industrial IoT, 3D printing, cobots, and increased cyber security.
At Thrive, we eat, sleep, and breathe efficiency. Our automated downtime tracking software measures efficiency within your operation in real-time, so you will stay up to date. Ready to Thrive? Request a free demo today!
Manufacturers generate production data constantly. Machines start and stop, parts are produced, changeovers happen, downtime accumulates, and performance changes throughout every shift.
The problem is that many facilities still rely on people to collect, enter, reconcile, and distribute that information manually. By the time a spreadsheet or shift report reaches management, the conditions it describes may already have changed.
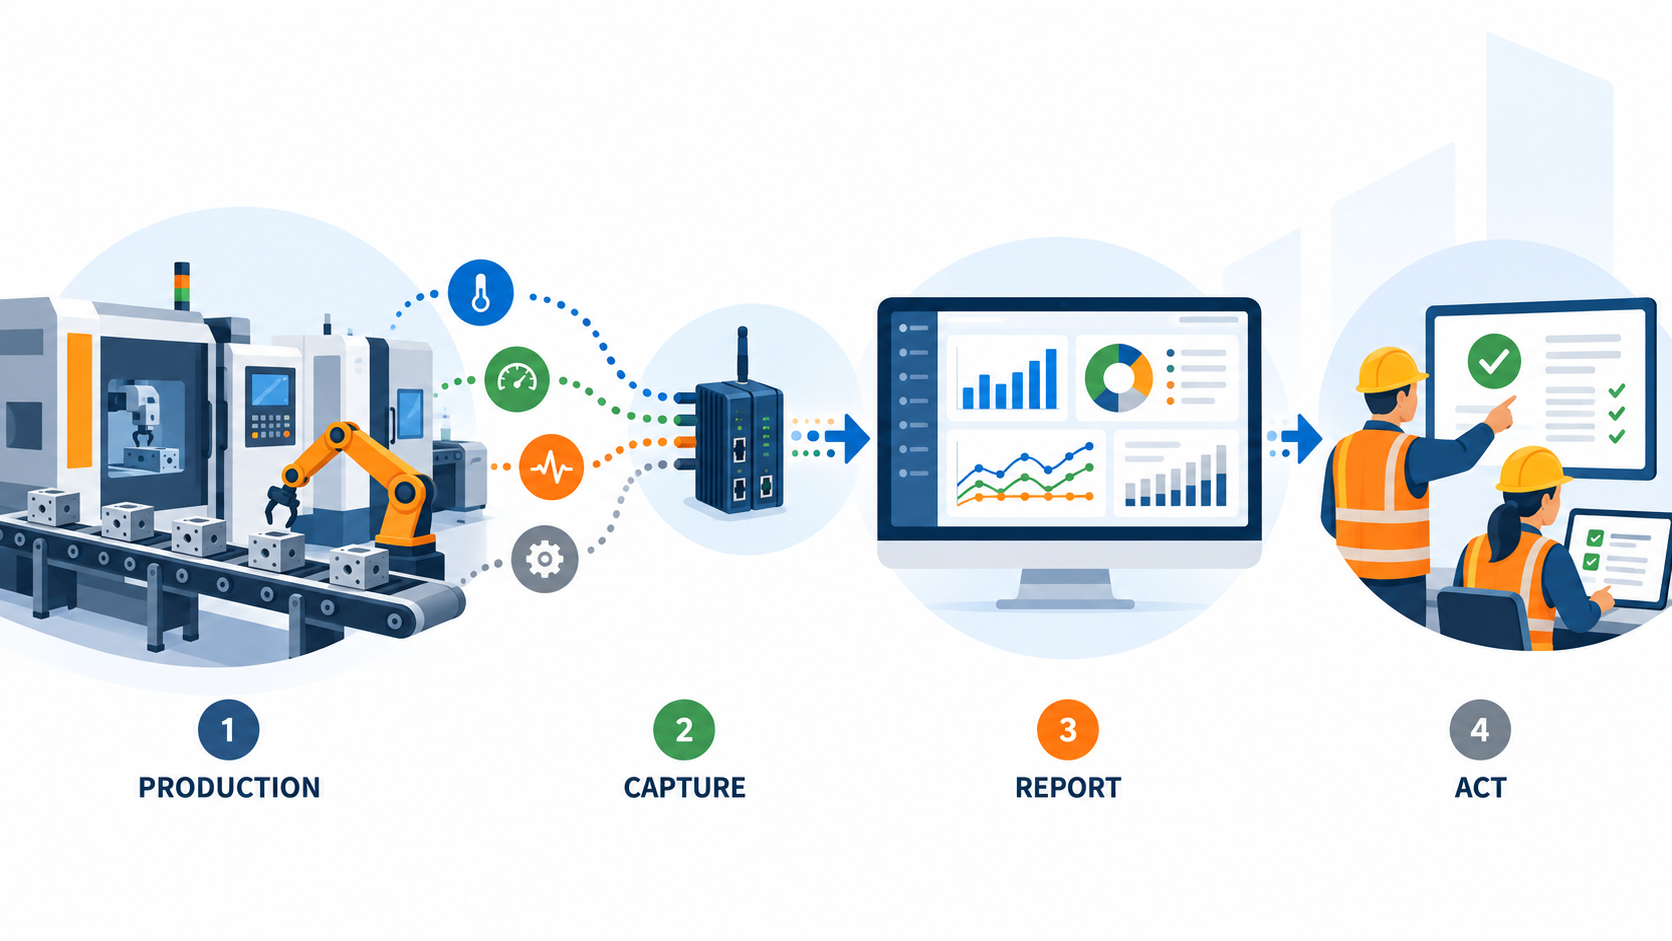
Automated production reporting reduces that delay by collecting production information directly from equipment and operational systems, organizing it automatically, and making current performance easier to understand and act on.
What Is Automated Production Reporting?
Automated production reporting is the process of collecting, organizing, and distributing manufacturing performance data automatically instead of relying primarily on manual recording and report preparation.
Depending on the production environment, that information may include:
Production counts
Machine running and stopped states
Downtime duration
Downtime reasons
Cycle times
Production rates
Scrap or reject counts
Shift performance
Equipment utilization
Overall Equipment Effectiveness (OEE)
Instead of waiting for an operator or supervisor to record everything at the end of a shift, an automated system can capture important production events as they happen.
That creates a stronger foundation for both immediate visibility and historical performance analysis.
Why Manual Production Reporting Creates Problems
Manual reporting can work at a basic level, but it becomes increasingly difficult as production environments grow more complex.
Common methods include paper logs, whiteboards, spreadsheets, shift-end forms, and supervisor summaries.
Reporting Is Delayed
Manual production information is often entered at fixed intervals, such as the end of a shift.
That means managers may be reviewing conditions that occurred hours earlier. A production problem that started early in the shift can continue much longer than necessary before anyone sees the pattern.
Short Events Can Be Missed
Operators naturally focus on keeping equipment running.
A 30-second stop, short jam, or quick reset may never make it into a manual log. When those interruptions occur repeatedly, the missing events can create a misleading picture of actual performance.
Different employees may describe the same event differently.
One operator may classify a stop as a mechanical problem while another records the same type of event as a material-feed issue.
Over time, those inconsistencies make trend analysis less reliable.
Report Preparation Takes Time
Someone has to collect the numbers, enter them, reconcile inconsistencies, prepare the report, and distribute it.
As the number of machines, shifts, products, and production lines increases, that administrative work can become significant.
Automation reduces the reporting burden so production teams can spend more time interpreting what happened and deciding what to do next.
How Automated Production Reporting Works
The technology varies by facility, but the basic process is straightforward:
Machine or Production Signal → Data Capture → Storage → Reporting → Operational Action
1. Production Data Is Captured
Information may come from:
PLCs
Machine controls
Sensors
Counters
Dedicated monitoring devices
Operator inputs
Other production systems
The goal is to capture important events consistently rather than depending entirely on someone remembering to record them later.
2. Production Events Are Given Context
Raw machine signals alone are rarely enough.
A reporting system may associate events with information such as:
Machine or line
Shift
Product
Operator or crew
Downtime category
Production target
Scheduled production time
That context turns machine activity into information that production teams can actually use.
3. Reports and Dashboards Are Generated
Once the information is collected and organized, reports can be produced automatically.
Manufacturers may be able to view performance:
In real time
By shift
By day
By machine
By production line
By product
Across departments
Across facilities
Reports may also be scheduled or generated on demand.
A useful reporting system should emphasize the metrics that support real decisions rather than displaying every available number. Thrive’s guide to building a practicalmanufacturing KPI dashboard explores that in more detail.
What Should Automated Production Reports Track?
There is no single set of metrics every manufacturer needs.
The right information depends on the production process and the decisions the report is intended to support.
Reporting Area
Example Information
Production output
Actual units vs. planned units
Machine status
Running, stopped, idle
Downtime
Duration, frequency, reason
Performance
Production rate, cycle time
Quality
Good units, rejects, scrap
Shift performance
Output and losses by shift
OEE
Availability, Performance, Quality
Trends
Performance over time
A plant manager may need a different view from a maintenance manager or line supervisor.
The goal is not to collect as much data as possible, but to give the right people reliable information they can use to improve production.
Automated Reporting vs. Real-Time Production Monitoring
These concepts are closely related, but they serve different purposes.
Real-time production monitoring focuses on what is happening right now.
For example:
Is the line running?
Has a machine stopped?
Is production falling behind target?
Has an unusual condition appeared?
Automated production reporting organizes both current and historical information so teams can compare performance across shifts, machines, products, and longer periods.
Real-time monitoring helps teams respond quickly.
Reporting helps teams understand performance and compare results.
Manufacturers often benefit from both. Thrive’s guide toreal-time production monitoring focuses more specifically on the immediate visibility side of production management.
Automated Production Reporting and Downtime Tracking
Production output and downtime should not be treated as completely separate datasets.
If a line produces fewer units than expected, managers need to understand what contributed to the loss.
Was the line stopped?
Was it running below its expected rate?
Did repeated short interruptions reduce throughput?
Did one failure account for most of the lost production?
Instead of reporting only that production missed its target, teams can connect the result to the events that contributed to it.
From Production Reports to Better Decisions
Automating a report does not automatically improve performance.
The value comes from using the information to identify losses and guide action.
A useful reporting process might follow this cycle:
Measure → Compare → Identify Loss → Investigate → Correct → Measure Again
For example, a production report may show that one line repeatedly misses its target on the second shift.
A deeper review may reveal that the same equipment experiences recurring material-feed interruptions.
That gives the team something specific to investigate.
Historical reporting is especially useful because it helps distinguish isolated events from persistent problems. Thrive’s guide tomanufacturing downtime data analysis explains how recurring downtime data can be used to identify patterns and prioritize improvement opportunities.
What to Look for in an Automated Production Reporting System
When manufacturers evaluate a reporting system, several capabilities matter more than simply whether it can generate a report.
Look for:
Automatic data collection from machines or production systems
Production and downtime visibility in a single reporting environment
Flexible reporting by machine, line, shift, product, or other useful dimensions
Historical trend analysis for comparing performance over time
Integration and export options where data needs to connect with other systems
Ease of use and scalability so the system remains practical as production needs grow
The best fit depends on the facility, the existing equipment, and the decisions production teams need to make.
Automated Reporting Should Make Production Easier to Understand
Automated production reporting should do more than replace a spreadsheet.
It should reduce the effort required to reconstruct what happened during a shift while making production performance easier to understand and act on.
The real value comes from answering practical questions:
Where are we losing production?
Which problems keep returning?
Which machines or shifts perform differently?
Are corrective actions working?
Where should improvement efforts be focused next?
Once that information is available consistently, production reporting becomes less about preparing reports and more about improving performance.
Manufacturers ready to move beyond manual reporting can learn more about Thrive’s production reporting system and how it combines production visibility, downtime tracking, and performance reporting.
Overall Equipment Effectiveness, OEE, is a metric that pinpoints productivity and efficiency in manufacturing operations by comparing true productive time and planned production time. To determine how productive an operation is, it combines three main metrics: availability, performance, and quality.
As a benchmark and evaluating tool, it can be used to compare the performance of production within the industry or in-house. OEE is also used to track data and progress over time to help eliminate waste from an operation.
Evaluating and Measure OEE
What exactly is a good OEE score? Just like tests or exams in school, the best score you can receive is 100%, but that doesn’t happen very often. A score of 100% means that a facility is maintaining absolutely perfect production- no stoppage time, no back-ups, no mistakes. Perfect isn’t always practical.
A score of 85% is considered “world class” and is a more achievable goal than a perfect score. World class or best in class performers have high efficiency in all areas of availability, performance, and quality.
The most common OEE score is 60%, meaning that an operation is only productive 60% of the time.
Laggards are the lowest tier of manufacturers. A score between 30% and 50% indicates extremely low productivity levels which could be caused by downtime or equipment performances.
Minor Stop Index
The minor stop index is a vital metric that measures the number of minor stops per hour that last 10 minutes or less. On average, a production line experiences almost 9 stops per hour (that equals to roughly 7 minutes per hour of downtime!).
Contrary to popular belief, the best in class performers are responsible for more minor stoppage than others. This is because world class performers have put in the time and resources to solve major issues that minor ones, like bottles breaking or label jams, take up most of their time.
Minor stops are the most common problems in the industry that consistently need time and attention.
Improving OEE
The best way to improve overall equipment effectiveness is to identify all problems in your operation. You can’t solve any issues until you’ve found the root of the problem!
According to the Manufacturing Benchmark Study by Informance, best in class performers knew where 99% of their day went, while laggards had no idea where 16.2% of the went! This statistic is alarming to say the least. For more perspective, laggard performers are unaware of where 9 minutes of every hour goes. It’s impossible to improve OEE without identifying the key problems in your operation.
Focusing on reducing short, minor stops will help boost availability in equipment. Availability is a vital metric because it is a critical indicator that most affects OEE improvements.
You can be the best in class
It’s time to raise the bar and become a world class performer. Prevent shutdowns, reduce changeover, and eliminate equipment downtime with our team at Thrive. Our Downtime Tracking System provides real-time data and reporting to aid in increasing efficiency and meeting production goals!
What are you waiting for? Are you ready to Thrive? Schedule a free demo and take the first step to becoming world class!
At the time being, how is your production line doing? Is it running efficiently? Any downtime? Can you identify the bottlenecks? Manufacturing lines are complex operations. The smallest manufacturers can struggle in knowing what is going on – imagine multiple production lines and multiple sites. With Overall Equipment Effectiveness (OEE), one obtains a real-time view from a single screen of production lines’ efficiency and the entire manufacturing operation.
OEE is a metric based on Availability, Performance and Quality and is used to help manufacturing companies improve their performance. Small improvements in OEE scores can produce substantial improvements in efficiency and profitability and deliver good Return on Investment (ROI) for the process monitoring and improvement effort.
OEE is a proven manufacturing management methodology that determines the profit dollar value of decisions while connecting plant floor to income statement. In real-time, the OEE can quantify if the company is making or losing money on a per-part and per-machine basis accurately. ROI and Real-time OEE reporting will help identify ways to save both time and money.
Performance identifiers include minor stops, bottlenecks, and speed loss, areas that can be harder to measure by estimating the situation. Availability includes unplanned downtime, scheduling, and utility issues. OEE will also include operator error; process upsets, and supply chain management.
By utilizing OEE for making business decisions, a business can increase efficiency and find a quick ROI. Some facilities have identified payback in a matter of weeks; they are leveraging OEE and specifically downtime tracking at an excellent level. Though there is no promise ROI will be in a matter of weeks, using OEE to make business decisions and then leveraging those to improve, they typically find ROI can be achieved in a matter of months.
The Lean methodology focuses on removing non-value-adding activities and waste to reduce complexity and cost. The Lean approach provides foundation for operational excellence by process standardization, worker empowerment and instills a culture of continuous improvement.
All employees are involved in continuously reviewing and improving efficiency throughout a process or value chain when Lean techniques are in place. Lean techniques may include visual controls to help operators identify the right times to adjust equipment, or preventive maintenance to reduce the number of equipment failures by proactively maintaining equipment.
OEE, a measurement used in Total Productive Maintenance programs, is a metric commonly found in Lean Manufacturing. The OEE metric and Lean process can help manufacturing answer three questions:
How often is the machine available to run?
How fast is the machine when running?
What is the count of acceptable parts made?
In addition to the three questions are six areas of losses that can affect the OEE and its three components. Breaking down the losses to these categories helps the Lean manufacturing team prioritize improvements.
Breakdown Losses
Breakdown losses falls under the OEE “availability loss” and Lean’s “unplanned stops” – sudden or unexpected equipment downtime that makes the machine less available. Contributing factors may include:
Major mechanical failures
Electrical system failures
Structural failure
Set-up & Adjustment Losses
Set-up and Adjustment Losses are an availability loss that falls under Lean six big loss of “planned stops”. The degree of loss depends on factors such as:
Standards process
Tooling consistency and quality
Skill-level of operator
Idling & Minor Stoppages
Production is interrupted by a temporary malfunction or when the machine is idling. This is an OEE performance loss and falls under the Lean “small stops”. Contributing factors include:
Defective products resulting from a line shutdown
Operator on other machine or other tasks
Temporary equipment malfunction
Reduced Speed Losses
This stage refers to the difference in equipment design speed and the actual operating speed. It is an OEE performance loss and a Lean “slow cycles”. Factors include:
Mechanical problems
Risk of making unacceptable parts at higher speeds
Operator training
Process Defects
Process defects occur during the stages of production – from machine start-up, warm-up, and “learning phase”. This stage is an OEE quality loss and “production rejects” in the Lean stages. The degree of loss depends on factors such as:
Maintenance of equipment
Tooling
Raw Material
Operator skill level
Reduced Yield
Losses in quality caused by malfunctioning equipment or tooling. An OEE quality loss, the degree of loss depends on factors such as:
Maintenance of equipment
Tooling
Raw Material
"A few months after installing the Thrive Downtime Tracking System"
we identified several key issues with our manufacturing line. Once corrected, our efficiency sky rocketed from 39% to 75%.
- Pat Kinnee, Splenda Continuous Improvement Engineer
"We're currently running 8% better than our budgeted throughput standards, "
so I consider it a win. Now we’re in a position where our other plants are interested in implementing the software.
- Pete Szelwach, Plant Manager at Lassonde Pappas and Company, Inc.
"We've been using Thrive for about a year with impressive results. "
Changeovers that used to take 33 minutes now only take 23. With around two each day, that time really adds up. Before using the software, we were 20 minutes into our morning shift before lines started running, and we’ve cut it down to just 8 minutes. Overall efficiency has spiked from around 45% to an average of 60%. Seeing the data has really helped us create a culture of ownership and accountability. Everyone watches the measurements and does their best to make sure things are running efficiently, because they can see the impact. With the help of Thrive, we’ve had zero overtime during our busy season. That’s a company first! Now that we’re meeting production goals, we can be proactive and schedule time to take lines down for preventative maintenance.
- Rollie Everson, Maintenance Supervisor, Amsoil
"We were ready to pay $250,000 for a downtime system when by accident we stumbled across Thrive MES on the internet"
“Not only did it offer everything the more expensive system did but it is a fraction of the price. We were even able to customize to our facility far within our budget.”
”After 2 years I was still able to teach them a few big things about the software that they didn’t know about. A recent major success they had was they were able to reduce their downtime by 17 whole shifts per year by making a small tweak in a process. Instead of stopping a machine to make a fabric slice for 1 minute, they slowed the machine down to make the slice while the machine was moving. They also noticed how much downtime changeovers caused so their scheduled department reduced their changesovers from 6 to 1 per week.”
- Steve Kaiser, Operations Manager, Sage Products
"Within 2 weeks their automated machines saw an increased efficiency by 20%"
by giving the operator real-time visibility, they took more ownership and responsibility for the machine’s output. As a result, it made the operator think twice about shutting down the line. ‘Can I correct this issue without shutting the machine down?
- John Batten, President, NHI Pullies Inc
"We've been able to cut our overtime by 60%"
as we identified that our change overs were the main source of downtime. Using this data to determine and implement solutions we were able to move from 12 hours shifts to 8 hour shifts. It also helped us reduce our quality issues by identifying sources of inefficiency.
- Mark Hennigan, Director of Operations, CHG
"We are really happy with it and love the planned downtime function."
The planned downtime function immediately identified excessive breaks and created accountability for the line running. Management now has real-time data.
- Keith Frazier, Maintenance Supervisor, Skyline Steel
"The real-time data"
in our break rooms and on our supervisor’s computers have created a real sense of urgency and ownership to improve our plant’s performance. You can’t argue with a 50 inch TV in the break room that updates every second.

 Awareness of the importance of the OEE metric has been growing among small business owners and managers. Many small manufacturers are looking to implement this metric to maximize their equipment efficiency. However, implementing the OEE metric properly can be a big change. Thankfully, small manufacturers are more agile than larger manufacturers, so they can streamline and restructure their operations more quickly. The main challenge that small manufacturers face is not the time it will take to implement OEE, but the fact they literally cannot afford confusion or poor implementation. Read on to learn how small manufacturers can efficiently