Manufacturing downtime costs more than the minutes a machine sits idle. A production stop can reduce output, leave employees waiting, trigger emergency maintenance, create scrap or rework, require overtime to recover production, delay shipments, and consume capacity that could have been used more profitably.
The true cost of manufacturing downtime is the value of production that cannot be recovered, plus the additional costs created by the interruption. That can include repair and maintenance expenses, labor inefficiency, overtime, scrap, rework, expedited shipping, penalties, and other recovery costs.
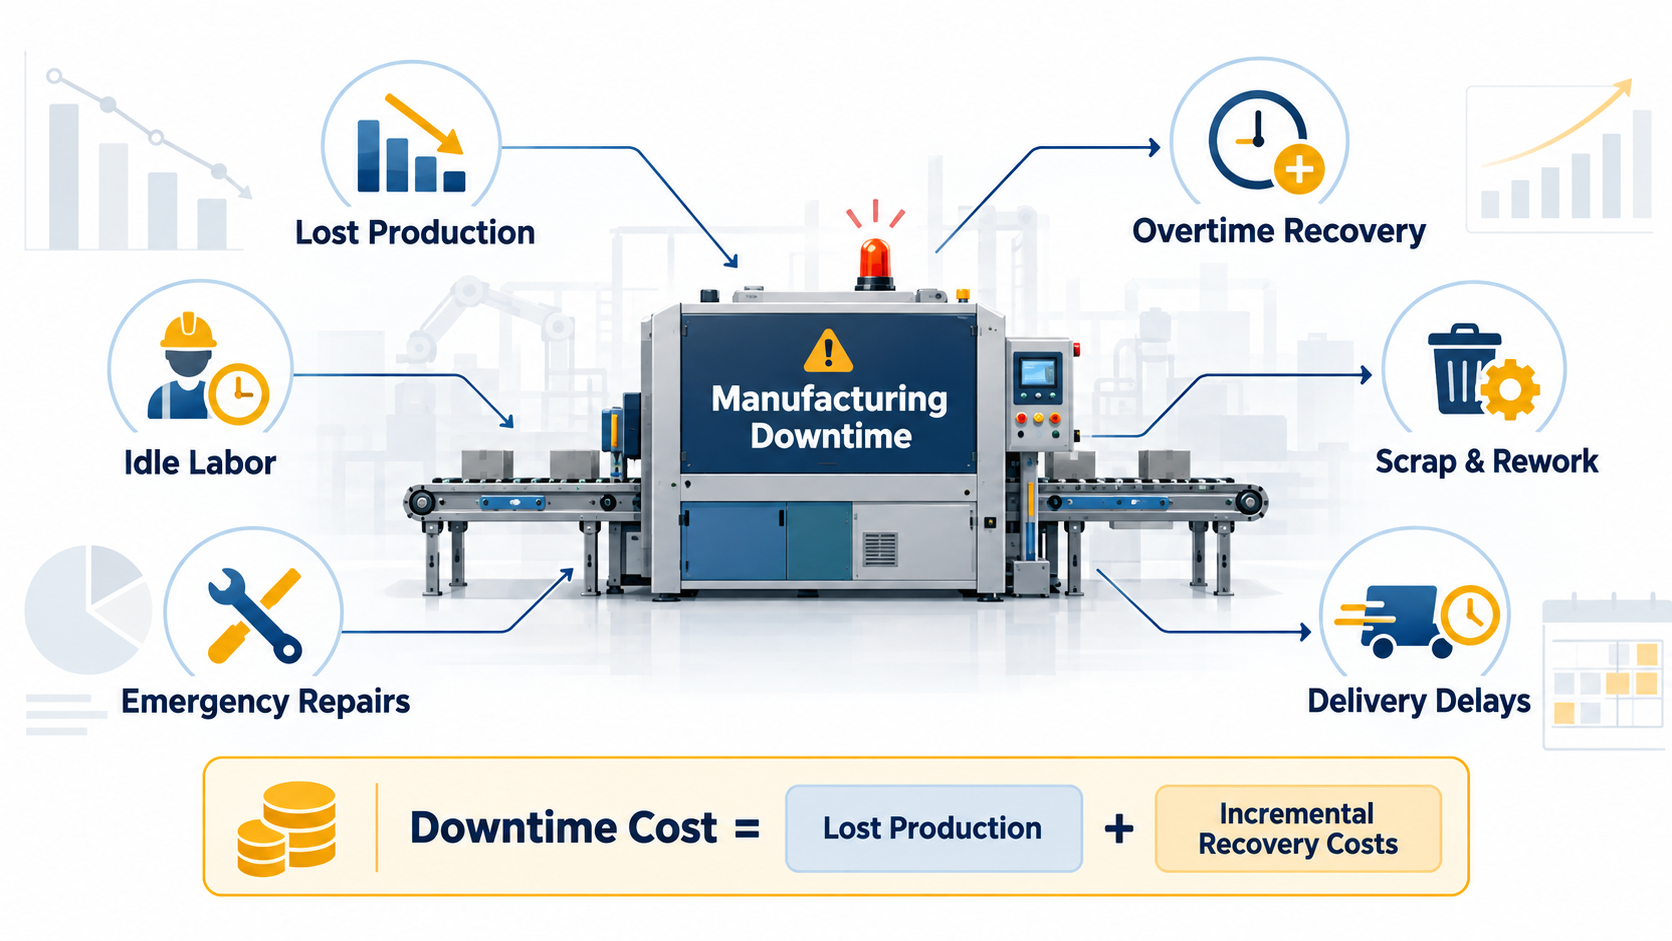
Understanding those losses turns downtime from a maintenance statistic into a business metric—and helps manufacturers decide which problems are worth solving first.
What Is the Cost of Manufacturing Downtime?
The cost of manufacturing downtime is the financial impact created when equipment, a production line, or a process cannot operate as planned.
Lost production is usually the most visible consequence. If a line normally produces 500 saleable units per hour and remains stopped for two hours, 1,000 units of scheduled capacity were lost during that period.
But that does not automatically mean the business lost the full selling price of 1,000 units.
If the production can be recovered later within normal available capacity, the financial impact may primarily consist of the additional costs required to catch up. If the plant is already capacity-constrained and those units cannot be recovered, the lost contribution from that production becomes much more important.
That distinction is essential. A useful downtime-cost calculation should reflect the economic impact of the interruption, not simply multiply stopped hours by sales revenue.
For manufacturers still establishing consistent measurement, a structured downtime tracking process provides the operational data needed to make these calculations meaningful.
What Costs Should Be Included in Manufacturing Downtime?
Lost output is only one part of the equation. Downtime can create costs across several areas of the operation.
Lost Production and Capacity
Every hour of downtime removes productive capacity from the schedule.
For a manufacturer operating close to capacity, those hours may translate directly into fewer saleable units. Even when the production can eventually be recovered, the interruption may displace other scheduled work or consume capacity that could have supported additional orders.
Repeated brief interruptions can be especially difficult to recognize. Individually they appear minor, but accumulated across shifts and production lines, micro downtime and small stops can consume a meaningful amount of available production time.
Idle and Disrupted Labor
Employees do not necessarily stop costing money when production stops.
Operators may wait for the process to resume, maintenance technicians may be pulled away from planned work, supervisors may coordinate recovery, and downstream employees may be unable to continue their own tasks.
Not every dollar of normal payroll should automatically be treated as an incremental downtime cost. But the loss of productive labor time is still operationally significant, particularly when recovery requires additional labor or overtime.
Emergency Maintenance and Repairs
Equipment failure can create costs well beyond the replacement part itself.
An unexpected breakdown may require:
- emergency maintenance labor;
- outside technicians;
- expedited replacement parts;
- maintenance overtime;
- rescheduled preventive maintenance;
- temporary equipment or workaround costs.
The production opportunity lost while the equipment remains unavailable may ultimately be much larger than the repair bill.
Overtime and Production Recovery
Lost production is often recovered rather than permanently abandoned.
But catching up may require an additional shift, longer operating hours, weekend work, or overtime. In that situation, the units are eventually produced, but the interruption still carries a financial cost.
This is one reason downtime can be underestimated: its effects often appear later in overtime or recovery budgets rather than being attributed to the original production stop.
Scrap, Rework and Restart Losses
Equipment problems do not always produce a clean stop.
Material may be trapped in the process when equipment fails. Restarting a line can generate additional scrap while settings stabilize. Equipment running outside normal conditions may also create quality problems before anyone recognizes that performance has degraded.
Scrap, rework, additional inspection, and restart losses therefore belong in the downtime-cost discussion when they were actually caused by the event.
Delayed Orders and Expedited Logistics
A production interruption can extend beyond the plant floor.
A missed schedule may require expedited freight, force production priorities to change, or threaten delivery commitments. Depending on the business, prolonged or repeated disruption can also contribute to contractual penalties or damaged customer relationships.
These costs are harder to quantify consistently, but that does not make them irrelevant.
How Does Downtime Affect Manufacturing Profitability?
Downtime affects profitability in two directions: it can reduce productive output while simultaneously creating additional expense.
More reliable production can help manufacturers:
- protect available capacity;
- meet schedules more consistently;
- reduce emergency maintenance;
- use labor more effectively;
- limit scrap and rework;
- reduce unnecessary overtime;
- improve delivery reliability;
- make better use of existing equipment before adding capacity.
But not every minute of downtime has equal financial value.
An hour lost on a lightly utilized machine with backup capacity may have little effect on total plant output. An hour lost at a bottleneck on a fully loaded production line may affect the entire operation.
That is why plant-specific economics matter much more than a generic “cost per hour” benchmark.
How Do You Calculate the Cost of Manufacturing Downtime?
A practical starting point is:
Downtime Cost = Lost Contribution From Unrecoverable Production + Incremental Costs Caused by the Stop
The calculation can be broken into four steps.
1. Measure the Downtime Event
Start with the operational facts:
- Which machine, line, or process stopped?
- How long was it unavailable?
- How much production was affected?
- Was the equipment a bottleneck or constraint?
- Were downstream processes also affected?
Accurate duration and production context are the foundation of the calculation.
2. Estimate the Production Opportunity Lost
Calculate how much saleable production would normally have been produced during the interruption.
A useful working calculation is:
Potential Lost Contribution = Downtime Hours × Units per Hour × Contribution per Unit
Contribution per unit is more useful than selling price when estimating genuinely lost production because variable costs associated with units that were never produced may also have been avoided.
Then ask the critical question:
Can the lost production be recovered?
If another shift, machine, or available production window can recover it without displacing other valuable work, the full contribution should not automatically be treated as lost.
3. Add Incremental Costs Caused by the Event
Include additional costs that occurred because the stoppage happened, such as:
- emergency repairs;
- additional maintenance labor;
- overtime;
- expedited parts;
- restart scrap;
- rework;
- outside contractors;
- expedited freight;
- contractual penalties.
Only count a cost once. A useful downtime model should clarify the economic impact rather than inflate it through overlapping assumptions.
4. Compare the Cost Across Events
The real value comes from applying the calculation consistently.
If one recurring failure costs approximately $500 per event and another costs $8,000, their improvement priorities should probably differ—even if the first problem occurs more often.
Combining financial impact with operational history allows manufacturers to rank problems more intelligently.
A Simple Manufacturing Downtime Cost Example
Suppose a production line:
- stops for 2 hours;
- normally produces 200 units per hour;
- generates $15 contribution per unit;
- cannot recover 50% of the lost production;
- incurs $1,200 in additional repair, scrap, and recovery costs.
Potential lost output:
2 hours × 200 units = 400 units
Unrecoverable output:
400 × 50% = 200 units
Lost contribution:
200 × $15 = $3,000
Add incremental recovery costs:
$3,000 + $1,200 = $4,200 estimated downtime cost
The same two-hour event could cost much less if all production can be recovered normally—or substantially more if the stopped line is a bottleneck and customer orders are lost.
That is why the assumptions behind the calculation matter as much as the formula itself.
Why Industry Downtime Benchmarks Need Context
Industry figures can demonstrate the scale of unplanned downtime, but they are poor substitutes for a plant-specific calculation.
Siemens’ True Cost of Downtime 2024 reported that an hour of unplanned downtime among surveyed automotive manufacturers could reach approximately $2.3 million. Costs differed substantially across industries.
The useful takeaway is not that every manufacturer loses millions of dollars per hour.
It is that downtime economics vary dramatically according to production value, utilization, equipment criticality, available buffers, recovery capacity, labor requirements, and the consequences of delayed production.
Instead of asking:
“What does an hour of manufacturing downtime cost?”
ask:
“What does an hour of downtime on this specific process cost our operation?”
That produces a number manufacturers can actually use.
Downtime Data Is What Makes Cost Analysis Useful
Calculating downtime cost tells you how important a problem may be. It does not explain why it keeps happening.
For that, manufacturers need context around each event: machine, line, shift, duration, product, process, and reason for the stop.
When events are categorized consistently, recurring patterns become visible.
A plant may discover that one mechanical fault creates the greatest financial loss. Another may find that material shortages, changeovers, minor stops, or a specific shift consume more capacity than major equipment breakdowns.
Looking at manufacturing downtime data over time turns individual incidents into patterns that can be investigated and prioritized.
Prioritize Downtime by Impact, Not Duration Alone
The longest downtime event is not necessarily the most important.
Consider two problems:
- Machine A fails for four hours twice a year.
- Machine B stops for ten minutes several times every shift.
Machine A produces dramatic incidents. Machine B may quietly consume far more annual capacity.
The reverse can also happen. A short interruption at the plant’s primary constraint may cost more than many hours of downtime on noncritical equipment.
A stronger prioritization model therefore considers:
Frequency + Duration + Production Impact + Financial Impact
That prevents improvement teams from focusing only on whichever failures are most visible.
How Manufacturers Can Reduce the Cost of Downtime
The objective is not to eliminate every minute of downtime. Planned maintenance, cleaning, changeovers, and other scheduled activities are necessary.
The goal is to reduce avoidable loss and make necessary downtime more controlled.
A practical improvement cycle is:
Track → Categorize → Analyze → Prioritize → Correct → Verify
Track
Capture downtime consistently rather than relying on memory, handwritten notes, or only the most serious breakdowns.
Categorize
Use meaningful reason codes so the data explains why production stopped.
Analyze
Look for repeated events, machines, shifts, causes, and patterns. Frequency and cumulative duration often reveal problems that individual incidents hide.
Prioritize
Combine operational impact with estimated financial cost. Addressing the most expensive recurring losses can produce more value than simply attacking the longest stops.
Correct
Investigate the underlying cause and apply the appropriate maintenance, process, training, material, or operational response.
Verify
Continue measuring the same loss after corrective action.
Improvement should appear in the data—not simply be assumed because a repair or process change was completed.
For problems where rapid detection matters, real-time production monitoring can help teams recognize developing production issues sooner rather than discovering them only after reviewing historical reports.
Turn Downtime Into a Business Decision
Manufacturing downtime affects more than equipment availability.
It can influence production capacity, labor utilization, maintenance spending, quality, overtime, delivery performance, and profitability. The most expensive effects often appear somewhere other than the original maintenance bill.
The better approach is to connect operational downtime data with business impact:
- Measure what actually stopped.
- Determine how much production was affected.
- Separate recoverable production from genuinely lost opportunity.
- Add costs directly caused by the event.
- Compare recurring losses consistently.
- Focus improvement efforts where recovered capacity has the greatest value.
The goal is not simply to report fewer downtime hours.
It is to understand where productive capacity and profit are being lost—and which problems are worth fixing first.
Turn Downtime Losses Into Actionable Data
Thrive helps manufacturers automatically capture machine downtime and production context so teams can identify recurring losses, understand why equipment stops, and focus improvement efforts where they can have the greatest operational impact.
Request a demonstration to see how Thrive can help make downtime easier to measure, analyze, and reduce.
Sources & References
- Siemens — The True Cost of Downtime 2024
- National Institute of Standards and Technology (NIST) — manufacturing maintenance and asset-condition research
- American Society for Quality (ASQ) — Cost of Quality