Machine and equipment downtime remains one of the most significant sources of lost productivity in manufacturing. Whether caused by equipment failures, changeovers, material shortages, quality issues, or operator-related interruptions, downtime directly impacts throughput, labor utilization, delivery performance, and profitability.
The challenge for many manufacturers is not simply that downtime occurs—it is that downtime is often poorly measured, inconsistently classified, or entirely hidden. Without accurate downtime data, organizations struggle to understand where production losses occur, which issues deserve attention, and whether improvement efforts are producing meaningful results.
Machine and equipment downtime tracking provides a structured approach to identifying, recording, analyzing, and reducing production interruptions. By capturing when downtime occurs, how long it lasts, and why it happened, manufacturers gain the visibility needed to improve reliability, increase operational efficiency, and support continuous improvement initiatives.
Modern downtime tracking systems go beyond basic recordkeeping. They provide real-time visibility into production performance, standardized downtime classification, historical trend analysis, and actionable insights that help teams prioritize improvement opportunities. Whether tracking a single production line or multiple facilities, effective downtime tracking transforms operational data into informed decision-making.
This guide explores the fundamentals of machine and equipment downtime tracking, including downtime categories, common causes, tracking methods, key metrics, best practices, and strategies for reducing production losses across manufacturing operations.
What Is Machine Downtime Tracking?
Machine and equipment downtime tracking is the process of identifying, recording, classifying, and analyzing periods when production equipment can’t perform its intended function. The goal isn’t just to know when a machine stopped — it’s to understand the duration, cause, frequency, and operational impact of each interruption.
Every production stop represents a potential opportunity for improvement. However, organizations cannot effectively address downtime issues without first understanding where they occur and what is causing them. Downtime tracking provides the data foundation necessary for identifying recurring losses, prioritizing corrective actions, and measuring the effectiveness of improvement initiatives.

- When the downtime event occurred
- How long the interruption lasted
- Which machine, line, or asset was affected
- The reason for the downtime event
- Whether the event was planned or unplanned
- The operational impact of the interruption
Downtime Tracking vs. Downtime Monitoring
Although the terms are sometimes used interchangeably, downtime monitoring and downtime tracking serve different purposes. Downtime monitoring focuses on detecting when equipment stops or experiences performance issues. It provides visibility into current operating conditions and alerts teams to active production interruptions.
Downtime tracking extends beyond monitoring by capturing historical records, assigning reason codes, identifying trends, and supporting long-term improvement efforts. Effective downtime tracking helps manufacturers understand not only when downtime occurred, but why it occurred and how similar events can be prevented in the future.
Types of Machine and Equipment Downtime
Planned Downtime
Planned downtime includes production stops that are intentionally scheduled in advance. These events are typically necessary to support equipment reliability, production flexibility, and long-term operational performance.
Common examples include:
- Preventive maintenance
- Scheduled inspections
- Product changeovers
- Equipment cleaning
- Employee training
- Planned facility shutdowns
Although planned downtime reduces available production time, it is generally considered a controlled and manageable activity. In many cases, properly planned downtime helps prevent larger and more costly unplanned interruptions.
Unplanned Downtime
Unplanned downtime occurs when equipment or production processes stop unexpectedly. These events often have the greatest operational and financial impact because they disrupt schedules, reduce throughput, and create uncertainty throughout the production environment.
Common sources:
- Equipment failures
- Tool breakage
- Material shortages
- Utility interruptions
- Quality issues
- Operator errors
- Sensor or control system faults
Because unplanned downtime directly affects production performance, reducing these events is often a primary objective of downtime tracking and continuous improvement programs.
Unknown or Unclassified Downtime
Unknown downtime refers to production interruptions that are recorded without a clearly identified cause. While these events may appear minor individually, they often represent one of the largest barriers to meaningful analysis.
When downtime events are categorized simply as “unknown,” “other,” or not classified at all, organizations lose visibility into recurring problems and improvement opportunities.
A high percentage of unknown downtime often indicates weaknesses in data collection processes, reason code structures, operator training, or accountability systems. Reducing unknown downtime is frequently one of the fastest ways to improve the quality and usefulness of downtime data.
Common Causes of Machine and Equipment Downtime
Downtime originates from a mix of equipment, process, material, and workforce factors. Most events fall into one of the following categories.
Equipment Failures
Mechanical and electrical failures remain among the most common causes of downtime in manufacturing environments. Worn components, lubrication issues, sensor failures, motor problems, and unexpected breakdowns can all interrupt production and require corrective maintenance. Repeated equipment failures often indicate underlying reliability issues that require more than temporary repairs.
Changeovers and Setup Activities
Changing from one product, batch, or production run to another frequently requires equipment adjustments, tooling changes, cleaning procedures, and validation activities. While changeovers are often planned, inefficient changeover processes can significantly reduce available production time. Many manufacturers target setup reduction initiatives because even small improvements can create meaningful gains in overall equipment availability.
Material Shortages and Supply Issues
Production equipment cannot operate efficiently when required materials are unavailable. Inventory inaccuracies, supplier delays, material handling bottlenecks, and scheduling issues can all contribute to downtime events that are unrelated to equipment performance. Tracking these events separately helps organizations distinguish supply chain challenges from equipment-related losses.
Quality Issues and Rework
Production may stop when defects, rejected parts, or process deviations require investigation and correction. In regulated industries, quality-related interruptions can be particularly disruptive due to documentation and compliance requirements. Downtime tracking helps organizations identify recurring quality-related losses and understand their impact on overall performance.
Operator-Related Interruptions
Downtime is not always caused by equipment. Training gaps, procedural errors, communication issues, delayed responses, and staffing challenges can all contribute to production interruptions. Capturing operator-related downtime events separately allows organizations to identify opportunities for process improvements, standardization, and workforce development.
Maintenance Delays
Equipment problems may be identified quickly, but production losses can increase significantly if maintenance resources, replacement parts, or technical expertise are not immediately available. Tracking maintenance response times and repair-related delays helps organizations evaluate maintenance effectiveness and prioritize improvement efforts.
Utility and Supporting Equipment Problems
Many production lines depend on supporting systems such as compressed air, conveyors, chillers, pumps, power systems, and material handling equipment. Failures in these supporting assets can stop production even when primary manufacturing equipment remains operational. Because these losses are often overlooked, they can become a hidden source of recurring downtime across the facility.
How Machine and Equipment Downtime Tracking Works
1. Detect the Downtime Event
The process begins when a production interruption occurs. Depending on the tracking method being used, downtime may be detected manually by operators, automatically through machine signals, or through connected sensors and monitoring systems. The objective is to identify downtime events consistently and as close to real time as possible.

2. Record Downtime Duration
Once an event is detected, the duration of the interruption must be captured accurately. Knowing that downtime occurred is useful, but understanding how long it lasted provides critical context for evaluating its operational impact. Accurate duration tracking helps distinguish between brief production interruptions and significant downtime events that require immediate attention.

3. Assign a Downtime Reason Code
Identifying why downtime occurred is often the most valuable part of the process. Reason codes provide the context needed to categorize events and understand recurring production losses. Examples may include - Mechanical failure, material shortage, changeover, quality issue, waiting for maintenance, and operator-related interruption. Without meaningful reason codes, downtime data becomes significantly less useful for improvement initiatives.

4. Analyze Trends and Patterns
As downtime data accumulates, manufacturers can begin identifying recurring issues, production bottlenecks, and loss patterns. Trend analysis helps teams move beyond isolated events and focus on the underlying factors that consistently affect performance. This stage often reveals opportunities that may not be obvious through observation alone.

5. Implement Corrective Actions
The ultimate goal of downtime tracking is not data collection—it is operational improvement. Once recurring losses are identified, teams can prioritize corrective actions, implement process improvements, and evaluate whether changes produce measurable results. Over time, this cycle of measurement, analysis, action, and verification creates a foundation for continuous improvement and more reliable production performance.
Effective downtime tracking is more than simply recording when a machine stops. It is a structured process that transforms production interruptions into actionable operational insights. Although tracking systems vary in complexity, most successful downtime tracking programs follow a similar workflow.
How Machine and Equipment Downtime Has Traditionally Been Tracked
For decades, manufacturers relied on manual processes to record downtime events. Operators, supervisors, and maintenance personnel were responsible for documenting production interruptions using paper forms, whiteboards, logbooks, or spreadsheets.
While these methods provided some level of visibility, they often depended heavily on human memory, consistency, and available time. In busy production environments, downtime events were frequently recorded after the fact, leading to incomplete records, inaccurate duration estimates, and inconsistent classifications.
Traditional downtime tracking methods typically involve:
- Paper downtime logs
- Shift reports
- Whiteboard tracking systems
- Spreadsheet-based reporting
- Supervisor observations
- Manual production records
Although these approaches can provide basic operational insight, they become increasingly difficult to manage as production complexity grows.
Why Manual Tracking Often Falls Short
Manual systems are often effective at identifying major downtime events but struggle to capture the smaller interruptions that collectively have a significant impact on production performance. Frequent short stops, micro-stoppages, waiting time, and recurring process interruptions can easily go unnoticed when data collection relies primarily on human observation. As a result, organizations may underestimate the true amount of downtime occurring within their operations and miss opportunities for meaningful improvement.
Why Machine and Equipment Downtime Tracking Is Critical
Every facility experiences downtime. What separates high-performing operations from those that struggle is how effectively that downtime is measured, understood, and addressed. Left untracked, downtime creates costs and blind spots across three areas:
Operational Impact
Poor visibility reduces throughput and capacity utilization, drives inefficient labor use, and increases the risk of missed delivery dates. Manufacturers often compensate by building unnecessary buffers and excess work-in-progress inventory. Frequent short stops - especially from supporting equipment - can quietly accumulate into major losses.
Financial Impact
Downtime costs go beyond lost output. There's the labor cost of operators, maintenance staff, and supervisors who stay engaged while equipment sits idle, plus overtime, expedited logistics, and repair costs. When downtime data is incomplete, organizations frequently invest in the wrong fixes, which limits the return on improvement spending.
Decision-Making Impact
Downtime data supports decisions related to maintenance prioritization, capital investment, staffing, and continuous improvement. Without reliable downtime tracking across machines and equipment, decisions are often driven by anecdotal observations rather than objective data.
Even seemingly minor interruptions add up: a two-minute stop that happens fifteen times a shift can cost more than one dramatic hour-long breakdown, but it rarely gets the same attention because it’s less visible. This is exactly why accurate measurement — not intuition — is the starting point for reducing the cost of downtime.
Modern Machine and Equipment Downtime Tracking Methods
Advances in manufacturing technology have transformed how downtime data is collected, analyzed, and used. Modern downtime tracking systems provide significantly greater accuracy, visibility, and consistency than traditional manual approaches. While implementation methods vary between facilities, several common approaches are used across modern manufacturing environments.

Operator-Assisted Digital Tracking
In this approach, operators use digital interfaces such as tablets, touchscreens, or production terminals to record downtime events as they occur. Digital forms help standardize data collection and improve the consistency of downtime classifications. This method is often easier to implement than fully automated systems while still providing substantial improvements over paper-based tracking.
Machine-Connected Tracking
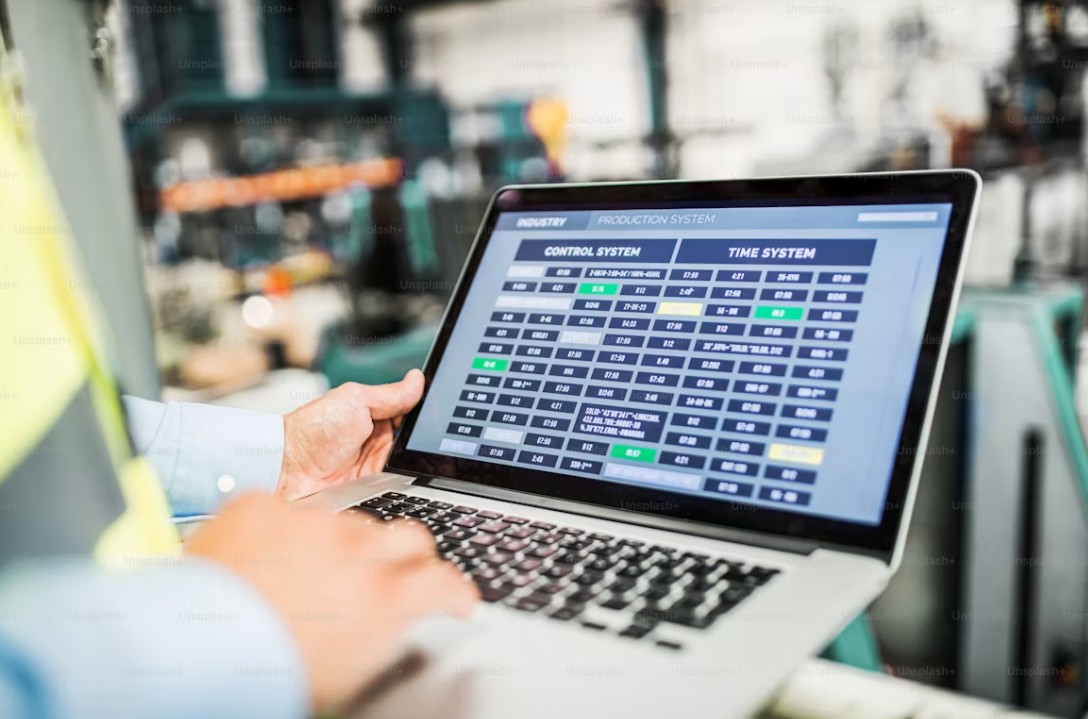
Machine-connected systems automatically detect downtime events using equipment signals, machine states, PLC outputs, or production counters. Because events are captured directly from the equipment, organizations gain more accurate visibility into machine availability and production interruptions. This approach significantly reduces reliance on manual data entry and helps ensure consistent event detection.
Sensor-Based Monitoring
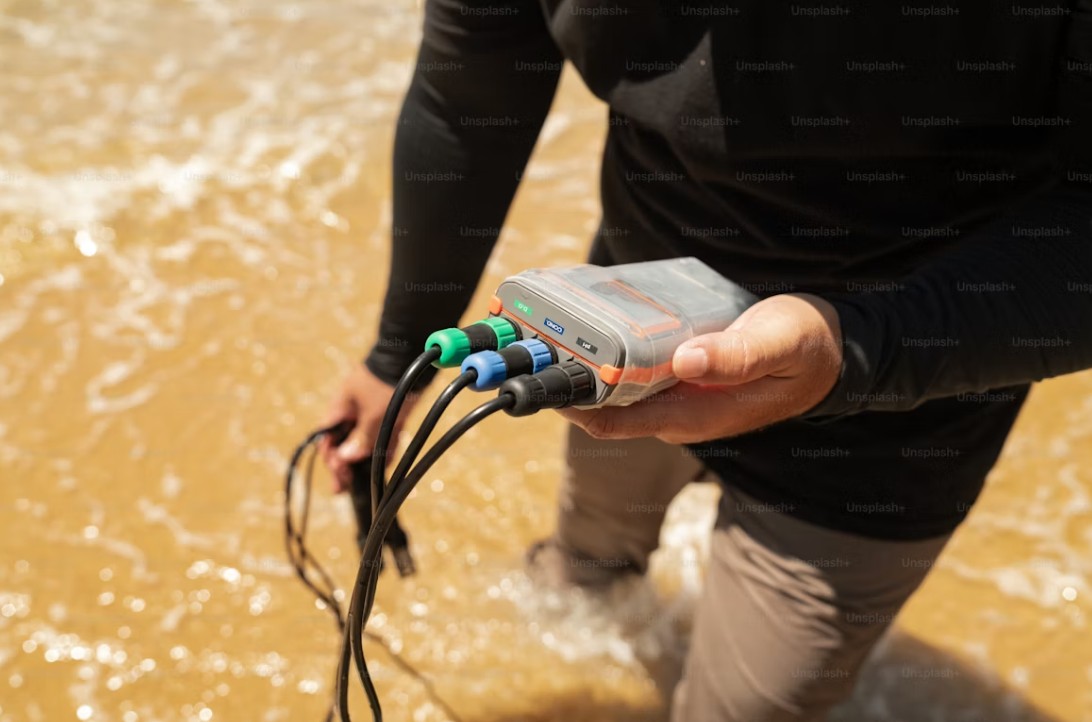
Additional sensors can be used to monitor machine activity, production flow, material movement, or equipment conditions. These systems help capture downtime events even when direct machine integration is unavailable or impractical. Sensor-based monitoring is commonly used to expand visibility across diverse equipment types and production environments.
Hybrid Tracking Approaches
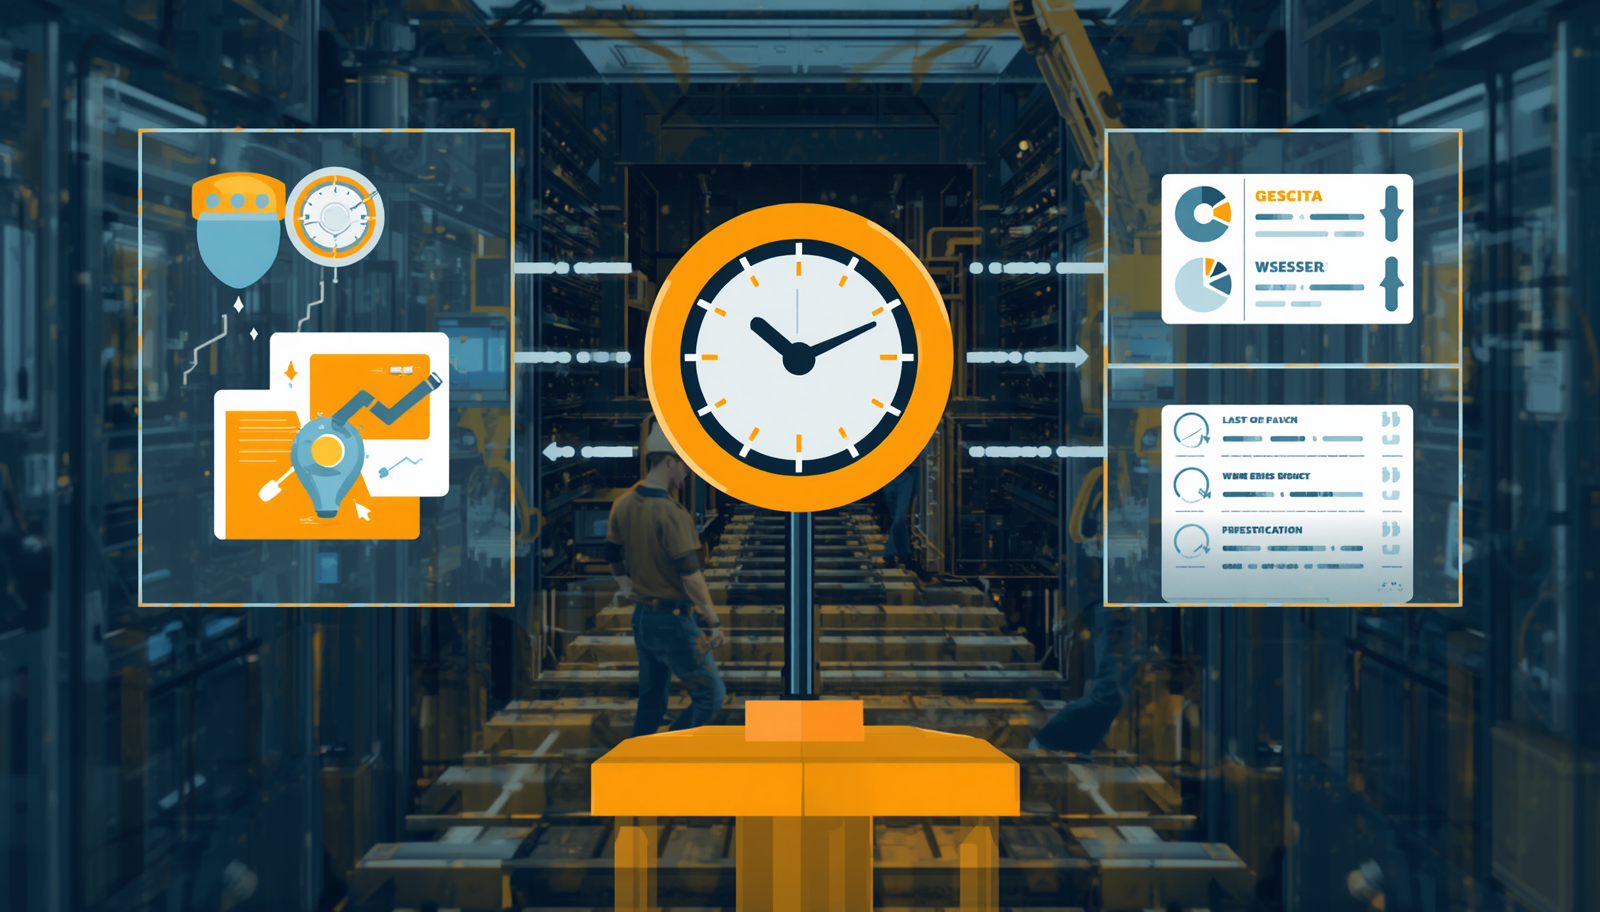
Many manufacturers combine automated event detection with operator input. Automated systems identify when downtime occurs, while operators provide context by assigning reason codes or additional details about the interruption. This hybrid approach often delivers the best balance between accuracy and operational insight.
Cloud-Based Multi-Site Tracking
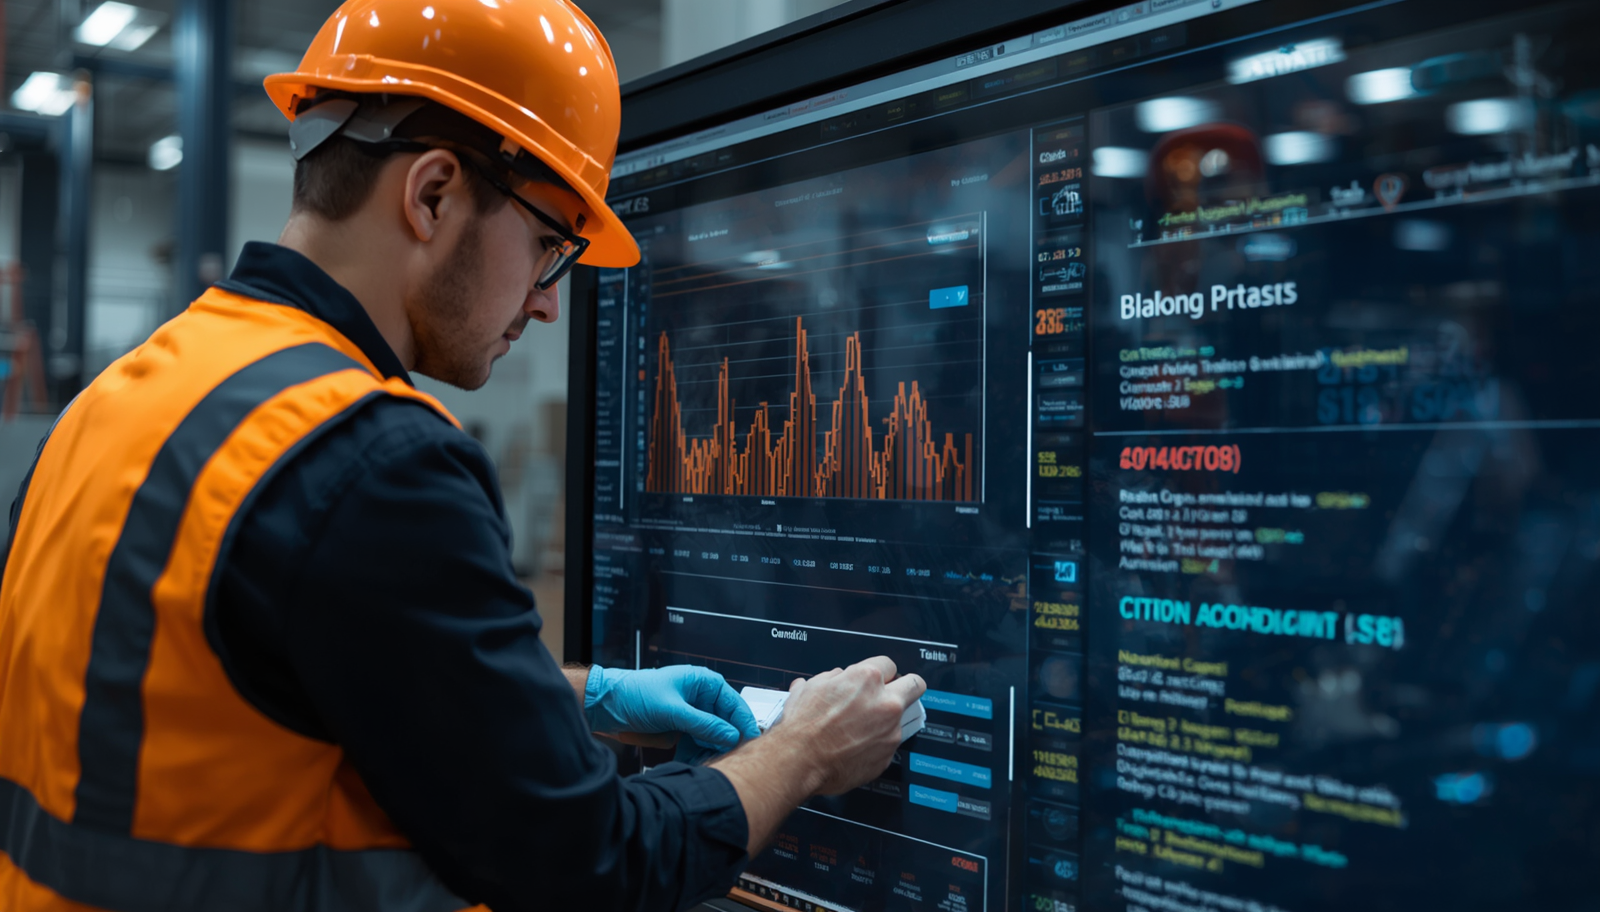
Cloud-based downtime tracking systems allow organizations to monitor performance across multiple production lines, departments, and facilities from a centralized platform. Operational leaders can compare performance, identify trends, and share best practices across locations using a common reporting framework. For organizations operating multiple facilities, centralized visibility can significantly improve decision-making and operational consistency.
Machine and Equipment Downtime Tracking Software Vs Manual Tracking
As manufacturers pursue greater operational visibility, many eventually reach a point where manual tracking methods become difficult to sustain. While spreadsheets and paper logs may be sufficient for basic recordkeeping, they often struggle to provide the speed, consistency, and analytical depth needed to support ongoing improvement initiatives.
Modern downtime tracking software helps organizations automate data collection, standardize reporting, and gain real-time visibility into production performance. A well-designed downtime tracking system helps reduce administrative effort while providing a more accurate understanding of production interruptions. Rather than spending time compiling data, teams can focus on identifying root causes and implementing improvements.
The benefits of software-based tracking become increasingly apparent as organizations expand operations, manage multiple production lines, or pursue continuous improvement programs that depend on accurate performance data. However, technology alone is not enough. The effectiveness of any downtime tracking system ultimately depends on the quality of the processes, classifications, and improvement efforts that support it.
| Factor | Manual Downtime Tracking | Machine Downtime Tracking Software |
|---|---|---|
| Data Capture Method | Logged manually by operators using paper forms or spreadsheets. | Automatically captured from machine states, sensors, or operator inputs in real time. |
| Accuracy | Prone to human error, estimation, and missed short stops. | Precise event-based recording with consistent time stamps. |
| Timeliness | Often entered after shifts, leading to delayed visibility. | Captured as downtime occurs, enabling immediate awareness. |
| Downtime Classification | Inconsistent reason codes across shifts and operators. | Standardized reason categories for reliable analysis. |
| Data Accessibility | Stored locally; limited visibility beyond supervisors. | Cloud-based dashboards accessible to authorized teams. |
| Scalability | Difficult to scale across multiple machines or facilities. | Structured to track downtime across lines, equipment, and plants. |
| OEE Integration | Manual calculations required; higher risk of error. | Integrated downtime data feeds directly into OEE metrics. |
| Root Cause Analysis | Limited historical consistency; difficult to identify trends. | Event-based historical data supports trend analysis and improvement initiatives. |
Key Metrics Used in Machine and Equipment Downtime Tracking
Effective tracking requires more than logging interruptions — it means monitoring the metrics that quantify downtime and reliability over time.
Downtime duration measures the total amount of time equipment is unavailable for production due to planned or unplanned interruptions. Tracking downtime duration helps organizations understand the overall impact of production losses and identify where the largest opportunities for improvement exist.
Downtime frequency measures how often production interruptions occur within a given period. A machine that experiences frequent short stops may require a different improvement strategy than equipment that experiences infrequent but lengthy breakdowns. Measuring frequency helps manufacturers distinguish between these different operational challenges.
Mean Time Between Failures (MTBF) measures the average amount of operating time between equipment failures.
Higher MTBF values generally indicate more reliable equipment and fewer unplanned interruptions. Organizations commonly use MTBF to evaluate equipment reliability, assess maintenance effectiveness, and identify assets that require additional attention.
Mean Time to Repair (MTTR) measures the average time required to restore equipment to normal operation after a failure occurs.
Reducing MTTR can significantly decrease overall downtime and improve equipment availability. Maintenance teams often use MTTR to evaluate repair processes, spare parts availability, and response effectiveness.
Availability measures the percentage of scheduled production time during which equipment is capable of operating.
Because downtime directly affects availability, many manufacturers use this metric as a high-level indicator of equipment performance and operational reliability.

Relationship Between Downtime Tracking and OEE
Downtime tracking directly feeds Overall Equipment Effectiveness (OEE) because downtime is what determines the availability component of OEE. While OEE also factors in performance and quality, accurate downtime data is the foundation for understanding availability losses — manufacturers who track downtime consistently get more reliable OEE numbers and a clearer picture of what’s actually limiting productivity.
Downtime Reason Codes: The Foundation of Meaningful Analysis
Capturing when downtime occurs matters — but knowing why is what makes the data useful. Reason codes are standardized categories that classify each event by underlying cause, turning individual records into patterns you can analyze across machines, shifts, and time periods.
Without a structured reason code system, a report can tell you a line lost six hours of production last week — but not whether that came from equipment failure, a material shortage, changeovers, or a quality hold. That distinction is the difference between a useful report and a number nobody acts on.
Building an Effective Reason Code Structure
The best systems balance simplicity and detail. Too few categories hide meaningful differences between events; too many make the system hard for operators to use consistently, which quietly erodes data quality. A tiered approach works well: broad categories for a consistent top-level view, with more specific codes available when needed.
Example Reason Code Structure
| Category | Example Reason |
|---|---|
| Mechanical | Bearing Failure, Belt Failure |
| Electrical | Sensor Fault, Wiring Issue |
| Material | Material Shortage, Material Jam |
| Quality | Defect Investigation, Rework |
| Changeover | Product Change, Tooling Setup |
| Operations | Waiting for Operator, Staffing Issue |
| Maintenance | Awaiting Repair, Awaiting Parts |
Avoiding “Unknown” and “Other” as Catch-All Categories
A high volume of events logged as “unknown,” “other,” or similar catch-alls is one of the clearest signs a downtime tracking process needs work. These categories may be unavoidable occasionally, but leaning on them heavily hides the patterns you’re trying to find in the first place.
Review reason codes periodically. If a large share of events consistently lands in the same vague bucket, that’s a signal to refine the classification structure, give operators more guidance, or dig into the underlying process. A well-designed reason code structure, maintained over time, becomes one of the most valuable assets in your downtime data.
Best Practices for Effective Machine and Equipment Downtime Tracking
These best practices help organizations improve data quality, strengthen analysis, and support long-term operational improvement.
Standardize Downtime Reason Codes
Consistent classification is the foundation of meaningful analysis. Standardized reason codes help ensure downtime events are recorded uniformly across shifts, departments, and facilities, making trend identification significantly easier.
Capture Events as Close to Real Time as Possible
The longer teams wait to record downtime events, the greater the likelihood of missing information or inaccurate classifications. Real-time or near-real-time data collection improves accuracy and reduces reliance on memory or estimation.
Focus on Root Causes, Not Symptoms
Stopping production is rarely the root cause of downtime. Effective improvement efforts seek to understand the underlying factors responsible for recurring interruptions rather than simply addressing the immediate event.
Review Trends Regularly
Downtime tracking creates the greatest value when data is reviewed consistently. Regular analysis helps organizations identify emerging issues, measure progress, and ensure improvement efforts remain aligned with operational priorities.
Engage Operators and Maintenance Teams
Operators often possess valuable insight into recurring production issues, while maintenance teams understand equipment reliability challenges. Involving both groups in the tracking and improvement process can significantly improve data quality and solution effectiveness.
Prioritize the Largest Sources of Loss
Not all downtime events deserve the same level of attention. Focusing on the most significant contributors to lost production often delivers faster and more measurable results than attempting to address every issue simultaneously.
Measure the Impact of Improvements
Improvement initiatives should be evaluated using objective performance data. Tracking downtime before and after corrective actions helps organizations validate results and refine future improvement strategies.
Machine and Equipment Downtime Tracking Maturity Model
Manufacturers typically progress through recognizable stages as their downtime tracking capability matures. Understanding where you currently sit helps you prioritize the next investment rather than trying to leap straight to “optimized.”
| Maturity Stage | Typical Characteristics |
|---|---|
| Reactive | Downtime is addressed after problems occur. Limited tracking and minimal historical data are available. |
| Basic | Downtime is recorded manually using paper logs, spreadsheets, or shift reports. Visibility is limited and analysis is often inconsistent. |
| Structured | Standardized tracking processes and reason codes are established. Organizations begin identifying trends and recurring issues. |
| Advanced | Automated event detection, real-time visibility, and integrated reporting improve accuracy and operational responsiveness. |
| Optimized | Downtime tracking is fully embedded within continuous improvement initiatives. Data consistently drives decision-making, reliability improvements, and operational performance gains. |
Most organizations don’t jump from Reactive to Optimized overnight — progress comes through incremental gains in data collection, standardization, reporting, and operational discipline. Knowing your current stage helps set realistic goals and a practical roadmap for improving visibility over time.
The Cost of Downtime: Understanding the Business Impact
The financial and operational cost of downtime extends well beyond the obvious lost output. When equipment stops unexpectedly, planned schedules get disrupted and available capacity drops – recovering that lost output often means overtime, schedule changes, or added operating hours.
There’s also a labor cost that’s easy to underestimate: operators, maintenance staff, supervisors, and support personnel often stay engaged while equipment is down and producing nothing. Over time, that idle-but-paid time erodes overall labor utilization.
Additional business impacts commonly include:
- Increased overtime expenses
- Higher maintenance and repair costs
- Missed delivery commitments
- Reduced customer satisfaction
- Increased work-in-progress inventory
- Lower equipment utilization
- Reduced operational flexibility
Frequent short stops often get less attention than a single dramatic breakdown, but their cumulative cost can be just as large — and it’s invisible without tracking. This is why many manufacturers treat downtime tracking as both an operational initiative and a financial one: accurately measuring downtime is the first real step toward reducing its cost.
From Data to Action: Building a Downtime Reduction Strategy
Collecting downtime data is only the starting point. Its value comes from using it to find patterns, understand root causes, prioritize the right fixes, and confirm whether those fixes actually worked. A repeatable process looks like this:
1. Identify the Largest Sources of Loss
The first objective is understanding where the greatest production losses occur. By reviewing downtime duration, frequency, and reason code data, organizations can identify which issues have the largest operational impact. Rather than attempting to solve every problem simultaneously, teams can focus resources on the areas with the greatest potential return.
2. Investigate Root Causes
Once major loss categories have been identified, the next step is determining why those losses occur. Historical downtime data can help reveal recurring patterns that may not be apparent from individual events. Root cause analysis then helps organizations move beyond symptoms and uncover the underlying factors contributing to recurring downtime. Tools such as failure analysis, process reviews, operator feedback, and maintenance records can all support this effort.
3. Implement Corrective Actions
After root causes have been identified, organizations can develop targeted improvement initiatives. Depending on the situation, corrective actions may involve maintenance improvements, process changes, operator training, equipment modifications, scheduling adjustments, or procedural updates. The goal is not simply to reduce downtime temporarily but to prevent similar losses from recurring in the future.
4. Measure Results
Improvement efforts should be validated using objective data. Comparing downtime performance before and after corrective actions helps determine whether initiatives are producing meaningful results. This measurement also helps organizations distinguish improvements that are producing sustained results from those that require further attention.
5. Repeat Continuously
Downtime reduction is not a one-time project. As operational challenges evolve, new opportunities for improvement emerge. Organizations that consistently track performance, analyze trends, act on data, and measure the results create a continuous feedback loop that can support sustained gains in equipment reliability, productivity, and operational efficiency over time.
What this discipline tends to produce, over time:
Increased Throughput and Capacity Utilization
Reducing recurring downtime gives production equipment more opportunity to operate during available production time. By identifying the interruptions that consume the most capacity, manufacturers can focus improvement efforts on losses that have the greatest effect on output.
Improved Equipment Reliability
Downtime patterns can reveal recurring equipment problems that may otherwise be treated as isolated incidents. Maintenance and operations teams can use this information to identify assets that require additional attention and evaluate whether corrective actions are actually reducing repeat failures.
Better Production Planning
Historical downtime data provides a more realistic view of how production assets perform under actual operating conditions. This information can help teams make better-informed scheduling and capacity decisions rather than relying solely on theoretical equipment availability or assumptions about production performance.
More Effective Use of Labor and Resources
Downtime can leave operators, maintenance personnel, and other resources engaged while production is not moving forward. Understanding when and why these interruptions occur can help organizations identify opportunities to improve response processes, reduce waiting, and use available resources more effectively.
Stronger Continuous Improvement
Perhaps the most important benefit is that downtime tracking creates a measurable foundation for continuous improvement. Teams can identify a significant source of loss, implement a corrective action, and then use subsequent downtime data to determine whether the change actually improved performance. This creates a repeatable improvement cycle:
Measure → Identify → Improve → Validate → Repeat
Over time, these incremental improvements can compound. A reduction in recurring changeover losses, short stops, equipment failures, or waiting time may appear modest when viewed individually, but sustained improvements across multiple loss categories can have a meaningful effect on throughput, capacity utilization, and operational performance.
Greater Operational Visibility
Perhaps most importantly, downtime tracking helps organizations develop a clearer understanding of how equipment, processes, and people interact within the manufacturing environment. This visibility supports more informed decision-making at every level of the organization.
How Thrive Supports Machine and Equipment Downtime Tracking

Successful downtime tracking depends on accurate data, consistent classification, and timely visibility. Thrive combines real-time data collection, downtime event tracking, and production reporting to help manufacturers see exactly where production losses occur and how they affect performance.
With Thrive, manufacturers can:
- Track machine and equipment downtime in real time
- Standardize downtime reason code collection
- Monitor production performance across lines and facilities
- Improve visibility into recurring downtime events
- Support OEE and continuous improvement initiatives
- Analyze historical trends and operational patterns
- Reduce reliance on spreadsheets and manual reporting
By transforming downtime events into actionable operational intelligence, Thrive helps manufacturers make more informed decisions about reliability, productivity, and performance improvement. Whether the objective is reducing unplanned downtime, improving throughput, increasing equipment utilization, or strengthening continuous improvement programs, accurate downtime tracking provides the foundation for measurable progress.
Frequently Asked Downtime Tracking Questions
Equipment downtime tracking is the process of monitoring and analyzing periods when production-critical equipment is unavailable due to planned or unplanned events. It’s closely related to machine downtime tracking and typically covers both primary machines and the supporting equipment that affects production flow.
The terms overlap heavily and are often used interchangeably. In practice, “machine downtime” usually refers to the primary production asset, while “equipment downtime” is broader – it also includes supporting systems like conveyors, compressed air, chillers, and material handling equipment that can stop a line even when the main machine is fine.
At minimum, planned downtime (maintenance, changeovers, cleaning), unplanned downtime (failures, material shortages, quality issues), and unknown/unclassified downtime. Tracking all three separately – rather than lumping them together – is what makes the data useful for prioritizing improvement work.
Downtime tracking feeds directly into the availability component of Overall Equipment Effectiveness (OEE). Since OEE also incorporates performance and quality, accurate downtime data is the foundation that makes the rest of the OEE calculation trustworthy.
Manual tracking (paper logs, spreadsheets) is a reasonable starting point but tends to miss short stops and produces inconsistent classification between shifts. Automated or machine-connected tracking is more accurate and scalable. Most manufacturers land on a hybrid approach – automated detection paired with operator-assigned reason codes – for the best balance of accuracy and context.
Relying too heavily on “unknown” or “other” as catch-all reason codes. It’s the fastest way to accumulate a lot of downtime data while learning almost nothing from it. A close second: treating downtime tracking as a one-time reporting project instead of an ongoing discipline that’s reviewed and acted on regularly.
Start Tracking Downtime with Greater Accuracy
Reducing downtime starts with understanding it. The more accurately you can identify, classify, and analyze production interruptions, the better positioned you are to improve reliability, increase throughput, and strengthen operational performance.
Whether you’re moving off manual tracking or improving an existing downtime process, consistent visibility is the first step. Schedule a demonstration to see how Thrive helps manufacturers track downtime, standardize data collection, and turn production insights into measurable results.